
Thoughts on high-quality drinking water and practice in Suzhou
The concept of high-quality drinking water, the current domestic standards for high-quality drinking water and the ideas for formulating standards are introduced. Several models for achieving high-quality drinking water were proposed, and the water quality characteristics of high-quality drinking water produced by different advanced treatment processes in water plants were discussed. At the same time, the high-quality drinking water demonstration project of Suzhou's secondary water supply and quality-separated water models was introduced.
1.Thoughts on high-quality drinking water quality
After carefully sorting out the high-quality drinking water standards in various places, we found that the main improvements have been made in the water quality indicators shown in Table 1. Corresponding to the national standard, high-quality drinking water has significantly reduced total dissolved solids and total hardness. These two indicators have a greater impact on taste. TDS around 300 mg/L has the best taste, so this indicator is Reducing it by half can effectively improve the taste of drinking water. A reduction in turbidity not only means an improvement in the sensory properties of drinking water, but also indicates a reduction in microbial risk. 2-MIB and GSM are typical representatives of odorous organic matter. Odor seriously affects the taste of drinking water and is easily detected by water drinkers. At the same time, the existence of odor also means that the water body is polluted. Closed water bodies such as reservoirs and lakes contain high levels of odorous organic matter, which affects the quality of drinking water. Therefore, reducing odor can effectively improve the taste of drinking water. Another notable feature of high-quality drinking water is that the organic matter index is low, and the oxygen consumption index is lower than the national standard of 3 mg/L. The degree of reduction varies from place to place. High-quality drinking water from all over the world uses TOC as an indicator of organic matter. Although TOC is also included in the national standard, it is not a mandatory implementation indicator. It can be seen from Table 1 that TOC is set at 3 mg/L in various places, which is significantly lower than the national standard of 5 mg/L. Some places have also revised their disinfection by-product indicators. Among them, Shanghai has the largest change, halving trihalomethanes, while Shenzhen has left it unchanged.
Table 1 High quality drinking water quality standards

The current national water quality standards use oxygen consumption index as the organic matter indicator, and total organic carbon is only used as a reference indicator. Using oxygen consumption index as an organic matter indicator is mainly based on the national detection level. Figure 1 shows the organic matter in the biologically activated carbon effluent of two water plants with different water sources. The activated carbon of X water plant has been running for 3 years, while the activated carbon of Y water plant has been running for 6 years. The oxygen consumption index of the two water plants is 1.5 mg/L, but the TOC is very different. The TOC of X water plant is 2.5 mg/L and that of Y water plant is 3 mg/L.

Figure 1 Changes of TOC and CODMn in different water plants with activ
In addition, the ratios of CODMn and TOC in different water sources are also different, as shown in Figure 2. The CODMn/TOC of Y water plant is 0.5 and that of X water plant is 0.6. The national standard CODMn/TOC is 0.6. This shows that the lower the CODMn/TOC, the higher the TOC for the same oxygen consumption index. This example shows that TOC can fully reflect the organic content of water, while CODMn can only partially reflect it. TOC should be used as a mandatory water quality indicator for high-quality drinking water.
Compared with the national standard, high-quality water has improved to a certain extent, but we still have a big gap when compared with internationally advanced countries such as Japan. Table 2 shows the water quality indicators of Tokyo, Japan, which are local standards in Japan. As can be seen from Table 2, it pursues higher drinking water quality with taste as the goal. Comparing Table 1 with Table 2, we can see that there is still a big gap between our high-quality water and Japan's. Take TOC as an example. Japan lists this as a water quality indicator that affects taste. Tokyo’s standard is 1 mg/L, and it can fully meet this standard.

Figure 2 Comparison of TOC and CODMn from different water sources
Compared with the national standard, high-quality water has improved to a certain extent, but we still have a big gap when compared with internationally advanced countries such as Japan. Table 2 shows the water quality indicators of Tokyo, Japan, which are local standards in Japan. As can be seen from Table 2, it pursues higher drinking water quality with taste as the goal. Comparing Table 1 with Table 2, we can see that there is still a big gap between our high-quality water and Japan's. Take TOC as an example. Japan lists this as a water quality indicator that affects taste. Tokyo’s standard is 1 mg/L, and it can fully meet this standard.
Table 2 Drinking water quality standards of Tokyo, Japan

2. Formulation of high-quality drinking water standards in Suzhou area
The implementation of high-quality drinking water in Suzhou is based on two lines of research on high-quality water standards and the construction of a high-quality water technology system, as shown in Figure 3. Investigate the quality of outlet water and pipe network water in Suzhou, and formulate high-quality water guidelines for Suzhou with reference to domestic and foreign drinking water quality standards and current conditions. The construction of a high-quality water technology system is studied in three ways: direct supply from water plants, secondary water supply guarantee, and quality water supply. The water plant directly supplies advanced treatment processes through ozone biological activated carbon and nanofiltration membrane, and studies the treatment effects and effluent quality of these two processes to see whether they meet the requirements of high-quality water standards. By studying the change patterns of water quality in the pipe network in Suzhou, we can understand the changes in water quality from water plants to users, and study secondary water supply treatment processes to improve and maintain water quality, thereby providing high-quality drinking water that is the same as or slightly improved than the water produced by water plants. . Quality-separated water refers to the quality-separated water supply based on different water quality requirements for residents' drinking water and water for other uses such as washing and flushing toilets. Separate water supply requires two sets of pipe network systems. The drinking part of the water supply is produced by nanofiltration or reverse osmosis, and the rest is directly supplied by municipal water.

Figure 3 Technical route for high-quality drinking water
High-quality drinking water standards are closely related to the water source quality, economic development level and water plant treatment technology in the region. Figure 4 shows the general technical route for the formulation of high-quality drinking water standards. The first is to find gaps, and select improved water quality indicators based on national standards and advanced international standards and taking into account regional characteristics. The second is to evaluate the water quality characteristics of raw water and screen characteristic pollutants to establish improved and new water quality indicators. Finally, based on water quality The quality of the inlet and outlet water of the plant shall be reviewed, and the feasibility of the proposed improvement and new water quality indicators shall be reviewed.

Figure 4 Technical route for setting high-quality water standards
3. Water plant treatment technology to achieve high-quality drinking water
The water plant treatment processes to achieve high-quality drinking water are mainly ozone activated carbon and nanofiltration. The "Thirteenth Five-Year Plan" Water Special Project Suzhou Research Team conducted long-term pilot tests on ozone biological activated carbon, nanofiltration and their combinations for Taihu Lake water. Based on the test results, a possible process combination for high-quality drinking water was proposed, as shown in Figure 5 Show. The treatment process of ozone activated carbon can be divided into conventional ozone activated carbon, conventional-ozone activated carbon-ultrafiltration and ultrafiltration-ozone activated carbon. Conventional-ozone activated carbon is currently the most mainstream advanced treatment process in China. Ultrafiltration can also be set up behind this process, or a carbon sand filter can be used to mainly prevent microbial leakage of activated carbon. There is also a new depth process that places ultrafiltration in front of ozone activated carbon. Since direct ultrafiltration will cause serious membrane fouling, ultrafiltration can be combined with online coagulation. The pilot test of the Suzhou project of the 13th Five-Year Plan for Water has shown that online coagulation can effectively control membrane fouling and enable ultrafiltration membranes to operate stably for a long time at higher fluxes.

Figure 5 Ozone biological activated carbon in-depth process
The comparison of conventional-ozone activated carbon and online coagulation/ultrafiltration-ozone activated carbon removal is shown in Figure 6. Figure 6 shows that online coagulation/ultrafiltration removes algae density and chlorophyll significantly better than conventional methods. Although the effect of ultrafiltration in removing organic matter is worse than conventional methods, the subsequent ozone activated carbon removal is better than conventional ozone activated carbon. This shows that ultrafiltration can effectively remove algae, suspended solids and colloids, helping to improve the removal effect of ozone activated carbon. The effect of online coagulation/ultrafiltration-ozone activated carbon on AOC removal is also much better than conventional ozone activated carbon.
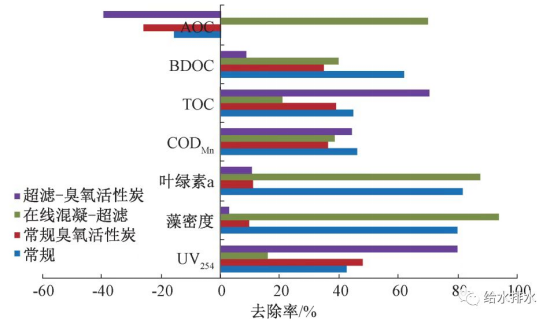
Figure 6 Comparison of pollutant removal effects between conventional-ozone activated carbon and online coagulation/ultrafiltration-ozone activated carbon
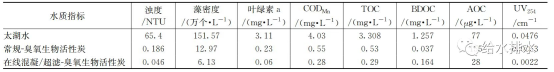
The comparison of effluent water quality between conventional-ozone activated carbon and online coagulation/ultrafiltration-ozone activated carbon is shown in Table 3. As can be seen from Table 3, except for BDOC, for the rest of the water quality indicators, online coagulation/ultrafiltration-ozone activated carbon is better than conventional-ozone activated carbon.
Table 3 Comparison of effluent quality between conventional-ozone activated carbon and online coagulation/ultrafiltration-ozone activated carbon
Nanofiltration can effectively remove organic matter in water while retaining minerals that are beneficial to the human body. Therefore, it is an ideal membrane technology for producing high-quality water. The core issue of the nanofiltration combined process is how to prevent the fouling of the nanofiltration membrane, thereby determining the nanofiltration pretreatment and the composition of the combined process. The water quality of nanofiltration inlet water has industry SDI standards, which should be lower than 3. However, SDI only characterizes suspended solids and colloids in the incoming water, which satisfies the requirement that SDI only prevents clogging of the membrane inlet channel. However, it is currently unclear how the pollution of the nanofiltration membrane, especially organic pollution, is caused. Although there are many small-scale studies, these results have little reference value for actual production applications. What can really illustrate the problem should be long-term pilot tests.
Possible combination processes for nanofiltration are shown in Figure 7. Conventional nanofiltration seems to be an ideal combination, and nanofiltration behind ozone activated carbon is also a possible combination process. The Mery-sur-Oise water plant in France is a typical representative of the nanofiltration process. Although the water plant uses ozone and microfiltration with a pore size of 6 μm as pretreatment, the nanofiltration membrane still suffers from serious seasonal pollution. Pilot studies in Suzhou have shown that macromolecular hydrophilic organic matter is the main factor causing fouling of nanofiltration membranes. Neither conventional nor ozone activated carbon deep processes can completely remove such organic matter, so it is not suitable as a pretreatment for nanofiltration. Ultrafiltration can completely intercept large molecules, so it is most suitable as a pretreatment for nanofiltration.
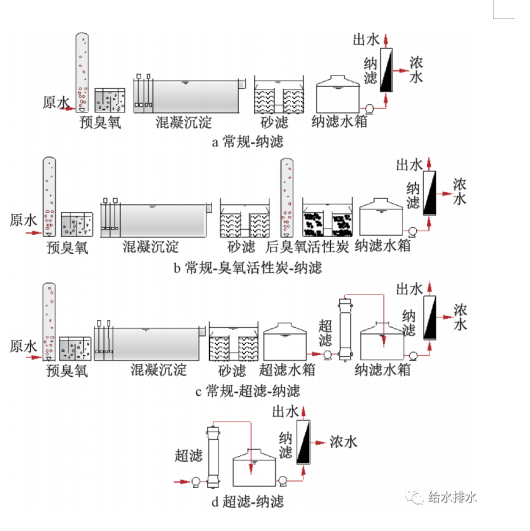
Figure 7 Nanofiltration membrane depth process
4. Ozone biological activated carbon and nanofiltration effluent quality
Ozone biological activated carbon is the mainstream treatment process to achieve high-quality drinking water. However, with operation time, the adsorption of activated carbon gradually becomes saturated, and the organic matter in the effluent also gradually increases. Understanding the changing patterns of organic matter in biologically activated carbon effluent can provide a basis for the formulation of relevant indicators for high-quality drinking water standards. To this end, the Suzhou research team conducted a detailed investigation and analysis of the water quality of biologically activated carbon effluent in Suzhou with different operating years, as shown in Figure 8. It can be seen from Figure 8 that with the running time, the TOC of the activated carbon effluent gradually increases. For NBDOC, at a certain running time, the NBDOC of the effluent is almost the same as that of the incoming water, indicating that the adsorption effect of activated carbon is almost lost, and for BDOC, the activated carbon A certain removal effect is still maintained, indicating that the later biological activated carbon removal mainly relies on microbial degradation. Throughout the long-term operation of activated carbon, TOC changes show a gradual increasing trend. Therefore, there is uncertainty as to whether ozone activated carbon can always meet the requirements of high-quality water during long-term operation.

Figure 8 Changes in organic matter during long-term operation of ozone biological activated carbon
The effect of nanofiltration on removing organic matter is shown in Figure 9. As can be seen from Figure 9, the TOC of nanofiltration effluent is stable below 05 mg/L and does not change with changes in organic matter in the raw water, which is much better than ozone biological activated carbon. Nanofiltration can also effectively remove odors, as shown in Figure 10. For two typical odorants, 2-MIB and GSM, the concentrations entering nanofiltration vary from 500 to 50 ng/L, and the concentrations in the effluent can be lower than 5 ng/L. Therefore, nanofiltration can provide us with high-quality drinking water stably.
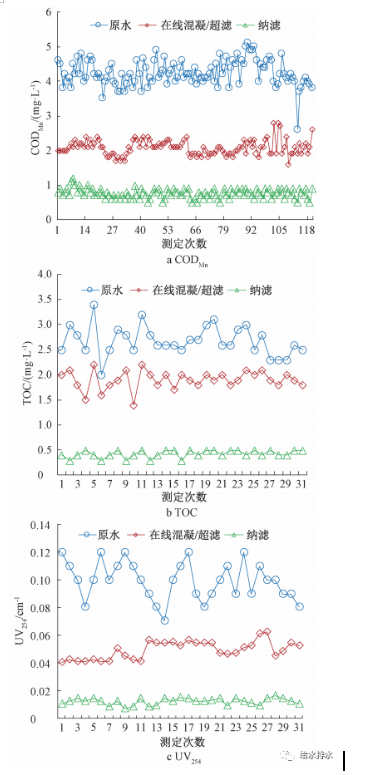
Figure 9 Effect of nanofiltration in removing organic matter
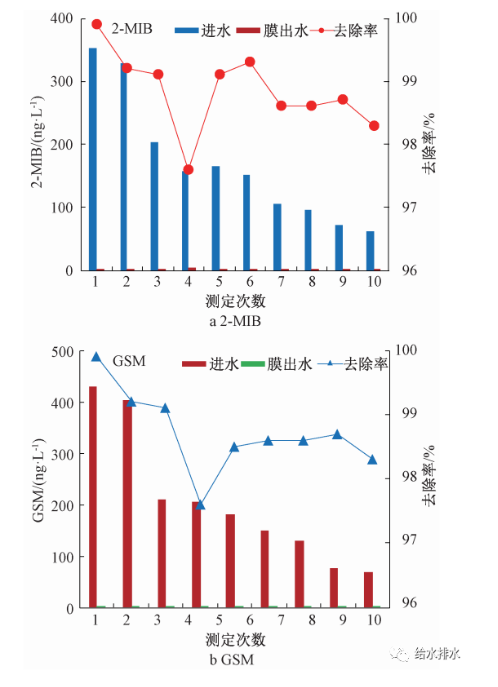
Figure 10 Effect of nanofiltration on removing odor substances
Although nanofiltration can effectively remove organic matter, it also traps inorganic ions. The inorganic ion content of nanofiltration effluent is also of concern. There are generally two types of nanofiltration, high desalination and low desalination. High desalination nanofiltration membranes have excellent removal effects for both organic and inorganic substances. Low desalination nanofiltration membranes have a lower rejection rate for inorganic substances, but still maintain good organic removal effects. Figure 11 shows the comparison of the removal of inorganic ions by these two nanofiltration membranes. As can be seen from Figure 11, the nanofiltration membrane with high desalination has a good removal effect on inorganic ions. Regardless of monovalent or divalent ions, the removal rate is around 90%. The nanofiltration membrane with low desalination, except for sulfate, removes 90%. %, and the removal of other ions is less than 30%. Not only that, low desalination nanofiltration membranes only require lower driving force to obtain higher flux, as shown in Figure 12.
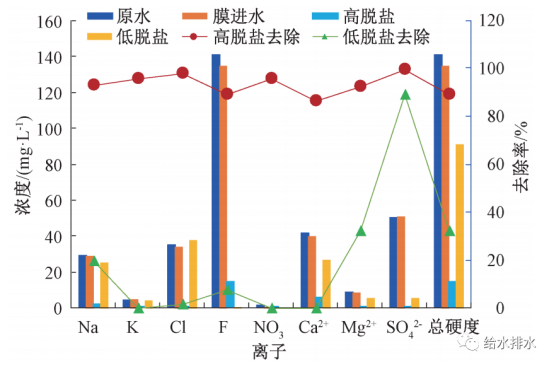
Figure 11 Comparison of removal of inorganic ions by two nanofiltration membranes

Figure 12 Comparison of driving pressures of two nanofiltration membranes
Figure 12 shows the driving pressure of two nanofiltration membranes when the flux is 25 L/(m²·h). The driving pressure of high desalination is basically 5 bar, while the driving pressure of low desalination is only 2~3 bar. Therefore, nanofiltration membranes with low desalination are very suitable for the production of high-quality water.
In order to remove organic matter as much as possible while ensuring the presence of certain minerals in the water, ultrafiltration effluent and nanofiltration effluent can be mixed. The mixing ratio depends on the required minerals, as shown in Figure 13.

Figure 13 Mixing method of nanofiltration process water
5 High-quality water in secondary water supply mode
5.1 Selection of treatment technology
The secondary water supply water quality maintenance mode means that after the tap water passes through the pipe network, the water quality has changed. By setting up a treatment device in the secondary water supply facility, the water quality can be restored to the state before leaving the factory or even slightly improved. Membranes are undoubtedly the most suitable technology of choice. For nanofiltration or ultrafiltration, since the nanofiltration membrane will produce a certain amount of concentrated water and the driving pressure is large, necessary pretreatment is required. Although the water quality is good, it is not suitable. Ultrafiltration membranes require no pretreatment, have high recovery rates and low additional costs, making them very suitable for secondary water supply treatment. Figure 14 shows the secondary water supply treatment device of a community in Suzhou. The membrane water inlet pressure is driven by the pressure of the municipal pipe network. After the membrane water is discharged, it enters the secondary water supply tank and is supplied to the residents of the community after UV disinfection.

图Figure 14 Secondary water supply ultrafiltration treatment process
5.2 Changes in water quality in pipe networks
When the factory water passes through the pipe network, the water quality will change to a certain extent. Understanding this change pattern can provide a basis for our secondary water supply treatment. Several sampling points are set up at a certain distance from the water plant to the demonstration community to analyze the changes in water quality with pipeline distance. Figure 15 shows the changes of disinfection by-products and residual chlorine with pipeline distance. It can be seen that disinfection by-products show an increasing trend with pipeline distance, while residual chlorine shows a downward trend. This shows that residual chlorine continues to react with organic matter in the pipeline to produce disinfection by-products. Figure 16 shows the change of biodegradable organic matter with pipeline distance, which also shows similar changes to disinfection by-products.
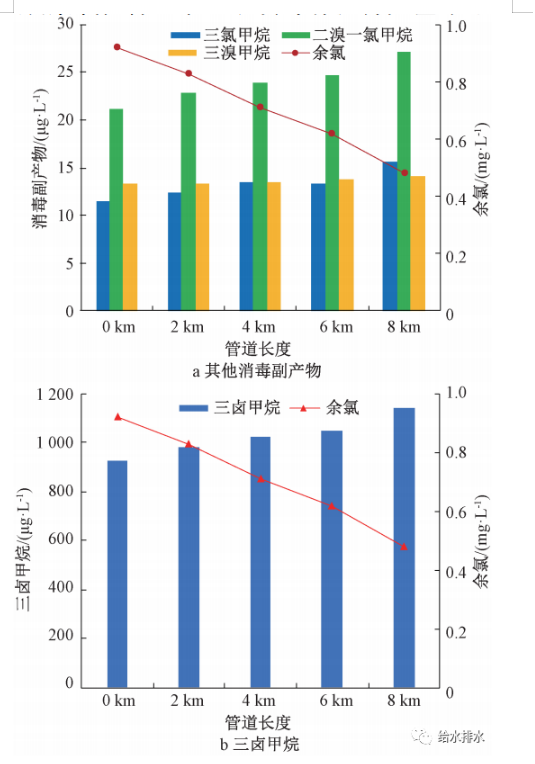
Figure 15 Changes in disinfection by-products and residual chlorine with pipeline length
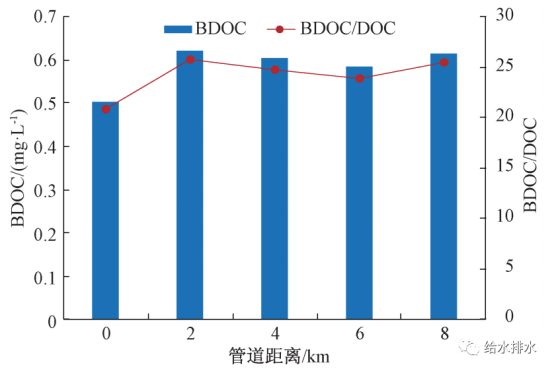
Figure 16 Changes in biodegradable organic matter with pipeline length
5.3 Processing effect
Figure 17 shows the effect of the ultrafiltration process on the secondary water supply of two communities in Suzhou (community A and community B) in removing disinfection by-products. Community B is farther from the water plant than Community A, so the content of disinfection by-products in the pipe network water is higher than that of Community A. The removal effects of chloroform, dichlorobromomethane, bromodichloromethane and tribromoform in plot A are 8%, 22.2%, 34.6% and 45.2% respectively, while the removal effects of plot B are 34%, 58.2%, 52.4% and 61.4 respectively. %. The removal rates of trihalomethanes were 31.16% in plot A and 64.54% in plot B respectively.

Figure 17 Effect of demonstration project on removing disinfection by-products
Figure 18 shows the effect of turbidity and TOC removal in the demonstration project. The turbidity removal effect is the most significant, which is 42.6% and 49.2% of plot A respectively. It also has a certain removal effect on TOC, which is 11.8% and 10.6% of plot A respectively.

Figure 18 The effect of the demonstration project on removing various pollutants
5.4 UV disinfection effect
For secondary water supply treatment, in order to ensure the safety of drinking water from residents' taps, ultraviolet disinfection is used. Figure 19 shows the effect of UV disinfection. With or without UV disinfection, no bacteria or microorganisms were detected in the entire process. It can be seen from Figure 19 that when the UV light is not turned on and there is only residual chlorine, the residual chlorine continues to decrease from the municipal water inlet to the residential faucet; TOC shows a slight increase trend after membrane filtration, and trihalomethanes also show a similar situation. When the UV is turned on, the TOC passing through the water tank increases, but decreases significantly after UV exposure. At the same time, the residual chlorine also dropped significantly. When there is only residual chlorine for disinfection, the trihalomethane in the water out of the water tank shows an upward trend; when the ultraviolet light is turned on, the trihalomethane in the water out of the water tank decreases. It can be seen that UV can effectively remove TOC and inhibit the increase of disinfection by-products. This is due to the combination of ultraviolet rays and residual chlorine, which produces an advanced oxidation effect and increases hydroxyl radicals, thereby enhancing the removal of organic matter. In secondary water supply, UV disinfection can reduce organic matter and disinfection by-products in residents' taps, thereby further ensuring residents' drinking water safety.

Figure 19 UV disinfection effect
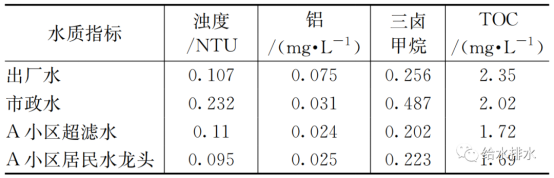
The water quality of secondary water supply is shown in Table 4. After the factory water passes through the pipe network, the turbidity and disinfection by-products have increased, while the organic matter and aluminum have decreased. After ultrafiltration treatment, all water quality indicators have decreased, and residents’ faucets have The water quality is better than factory water.
Table 4 Water quality of secondary water supply
6. Quality-differentiated water supply model of high-quality water
Quality-separated water supply refers to the use of different water qualities for drinking and other uses. The latter uses municipal water directly, while the former requires further treatment. Figure 20 shows the quality-separated water supply treatment process flow of a school in Suzhou, which is sand filtration - activated carbon - ultrafiltration - nanofiltration - ultraviolet disinfection. Sand filtration removes turbidity, which is beneficial to subsequent activated carbon adsorption. Activated carbon removes residual chlorine. In order to avoid oxidation of nanofiltration, ultrafiltration provides guarantee for the long-term stable operation of nanofiltration.
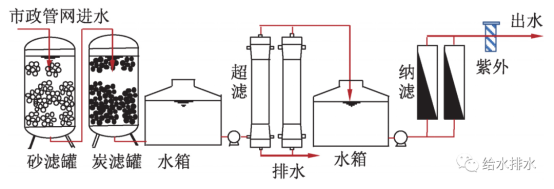
Figure 20 High-quality water treatment process of a school in Suzhou
Comparing Table 5 with Table 4, it can be seen that the quality-separated water is significantly better than the secondary water supply. This is due to the use of nanofiltration membranes in the quality-separated water. However, the nanofiltration process is relatively complex and requires ultrafiltration and activated carbon as pretreatment to ensure the stable operation of the nanofiltration membrane.
Table 5 Water quality of differentiated water

7. Conclusion
The water supply plant in Suzhou City has fully implemented the in-depth process of ozone biological activated carbon, and the quality of the factory water has reached high-quality drinking water. However, after the factory water passes through the pipe network, factors such as pipe material, water age, corrosion and scaling cause changes in water quality, mainly turbidity, an increase in disinfection by-products, and a decrease in residual chlorine. Renovating the pipe network and replacing pipe materials to maintain water quality is not suitable due to the huge investment. Therefore, if Suzhou wants to achieve the goal of high-quality drinking water from residents' taps, it should adopt a secondary water supply model to maintain water quality. The practice of Suzhou's "13th Five-Year Plan" demonstration project shows that applying ultrafiltration treatment to maintain and improve water quality can effectively ensure high-quality drinking water from residents' taps, with low investment and water production costs. Although the water quality of the separated water model is better, it uses nanofiltration membranes, the process is complex, and the water recovery rate is low. It is more suitable for the direct drinking water supply of high-end business buildings and schools.
Recommended Posts
-
 武汉军山方舱医院为新型冠状病毒肺炎患者临时定点收治单位,其产生的污水中含有大量的细菌、病毒等致病微生物、有机物、悬浮物等,具有较高的传染性和危害性。 本文介绍该医院污水处理的方式:“预处理+以膜生物反应器为核心的智能一体化污水净化系统(ICWT)+复合消毒”,处理后出水各指标均可达到《医疗机构水污染物排放标准》(GB18466-2005)所规定的排放限值要求。同时,系统全流程密闭,臭气全收集消毒处理,避免了气溶胶扩散途径。 一 方舱医院污水设施需求 方舱医院是为应对本次新型冠状病毒肺炎疫情所设立的临时性集中收治点,其污水处理设施需满足以下要求: 1、安全性要求高 其污水中含有大量细菌、病毒等致病微生物,具有空间污染、急性传播和潜伏性传染的危险,若不能妥善处理,可能会导致环境的污染,引起病毒的扩散、变异甚至出现疫情的扩散,因此处理设施需对污染物,尤其是致病污染物具有较好的处理效果。 2、抗冲击能力强 方舱医院污水主要来自病人洗漱、洗浴、大小便等,排放时间相对集中,因此水量水质的时变化较大...


comment